The 2021 Texas Power Crisis is a typical example of interdependent system failures. Three consecutive winter stomrs hit the southern part of the US, causing long-lasting natural gas pipeline network failures. These failures propagated to the electricity grid, reducing the power generation in large scale, and forced the ERCOT to launch a three-day rotating outage. As our energy systems become more interdependent to each other, such interdependent systen failures can happen more frequently in the near future with the climate change.
To safeguard the reliability and resiliency of interdependent energy systems, we are engaged in operating them more wisely to avoid potential failure propagations, and to enhance the overall efficiency. However, a joint optimization strategy may face the difficulty of solving an ultra-high dimensional nonconvex problem, and each system may not be able to share their respective models due to critical infrastructure security, privacy concerns, and conflicts of interests. An alternative way can be exchanging safety information between these systems such that each system respects others' constraints for its own operation.
The loadability limit is one of the critical information that secures steady state operations. It is a high-dimensional region that encloses safe operations for all the variable loads. In the recent work, Estimating Loadability Region of Natural Gas System via Monotone Inner Polytope Sequence, we have shown that under certain conditions the loadability region of natural gas network is convex, and proposed an efficient approach to approximate this region by a sequence of inner polytopes. The inner polytope information can be easily implemented for fast feasibility screening and sharing with other energy systems. For example, using the thrid inner polytope to screen over 190,000 different loading conditions for the Belgium high pressure gas network can be 2,460,000X faster than solving the gas flow problem, with a compromise of 4.8% conservativeness.
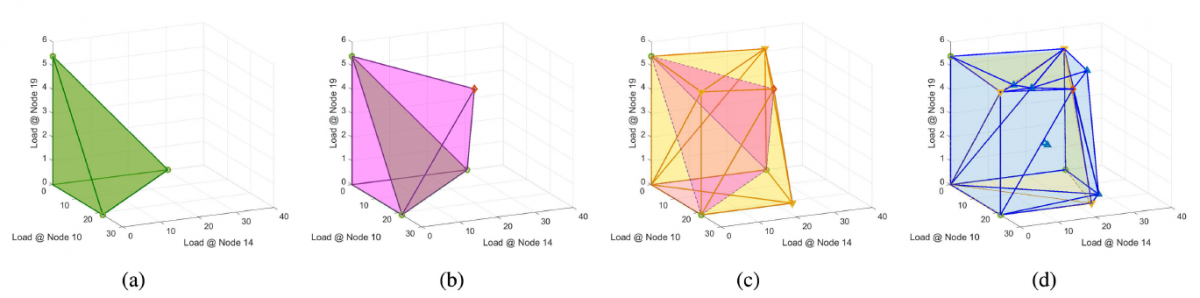
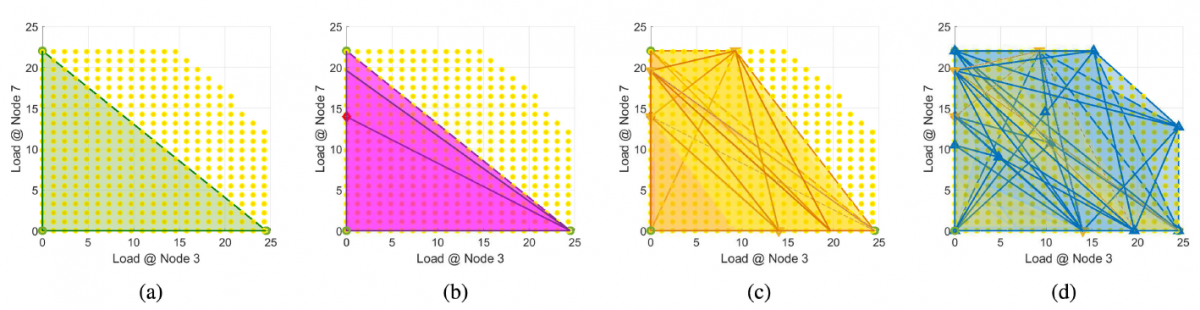
Upper row: how the inner polytope sequence is generated. Bottom row: comparing inner polytope to the true loadability region (yellow dotted region)