Besides liquified natural gas (LNG) storage tanks, the transportation pipelines also serve as a critical storage method. The gas stored in the network pipelines is called the "linepack", which can keep gas service for some time if production-consumption mismatch happens (see MIT LL report). However, under long-lasting extreme weather conditions, especially during the winter, or with compressor station failures, the linepack can be depleted, resulting in gas outage/shortage.
Evaluating how long the gas network can sustain in those conditions is critical for understanding the survivability and resiliency of the gas network, which can further facilitate interdependent energy system reliability studies, failure cascade analysis, and restoration schedulings. Since the linepack depletion is a dynamic process, it requires solving dynamical equations. Accurate compressible fluid models based on the Navier-Stokes partial differential equation (PDE) is slow to simulate. By leveraging the gas network slow transient behaviors, complicated PDEs can be reduced to ODEs, which accelerates the simulation speed with fine error rates. However, the existing ODE approximations either explicitly or implicitly require an ideal source node with infinite gas production capability. Such an assumption is similar to the "slack bus" in power grids. This ideal source node will eventually compensate all the mismatch in the network, making it hard to evaluate the linepack depletion dynamics.
To better capture the linepack depletion dynamics under extreme working conditions, in Dynamic Linepack Depletion Models for Natural Gas Pipeline Networks we proposed two different ways to limit the ideal source node with finite gas production capability. Besides limiting the gas production capability, another new treatment deals with the situation when the source node automatically reduces its designated pressure value after reaching its production limit to avoid the "choke" or "stonewall" phenomenon. A comparison of the dynamic responses in the Belgium high pressure gas network system with the same ramp up of a demand between the proposed linepack depletion models and the ideal source node model is shown in the following plot. The simulation times are less than 1 min for the entire process, which makes the proposed models very appealing for large-scale gas network survivability analysis. A demo code can be found here.
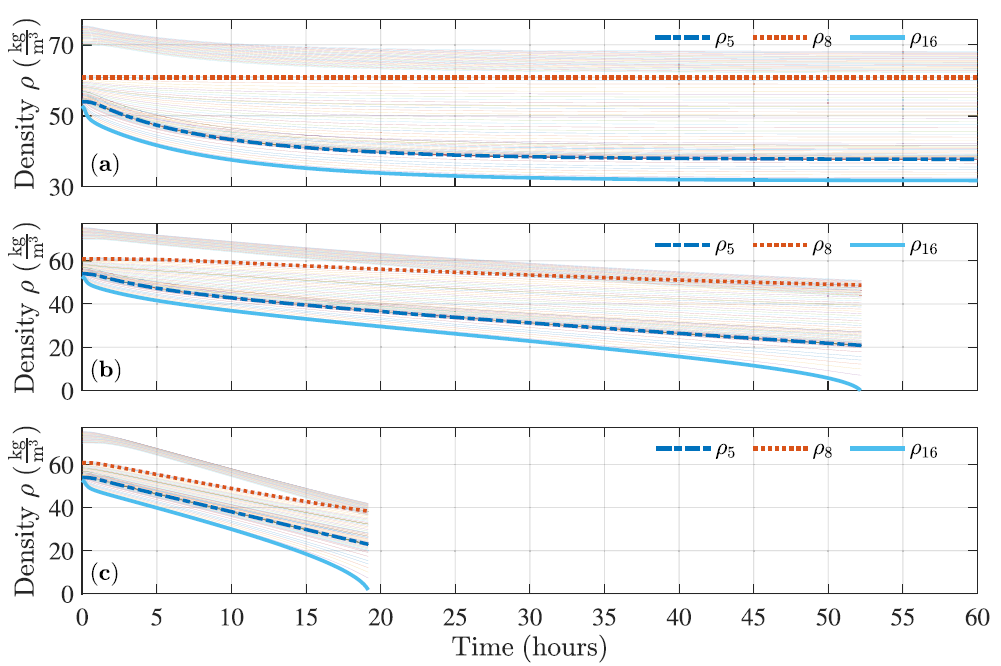
Upper plot: dynamic response of the ideal source node model, the linepack eventually settles to a new equilibrium, no linepack depletion happens.
Middle plot: dynamic response of the finite flexible source node model, the linepack depletes after 52 hours.
Lower plot: dynamic response of the finite regid source node model, the linepack depletes after 19 hours.